Correlations Between Thoroughbred Race Results and Blackjack Variance in Regulated Online Platforms
Amir Simon · Jul 25, 2026
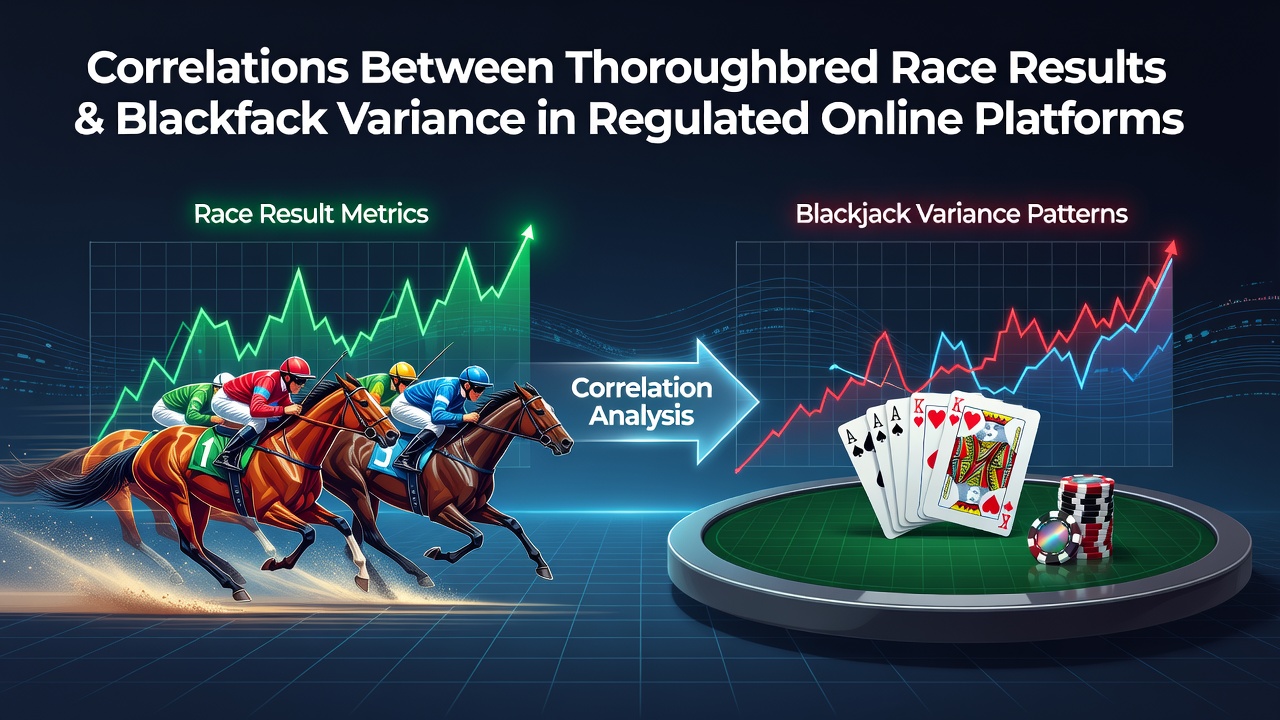
Correlations Between Thoroughbred Race Results and Blackjack Variance in Regulated Online Platforms
Thoroughbred race results generate detailed performance records across thousands of events each year while blackjack variance follows predictable mathematical distributions in regulated online environments, and analysts have investigated whether measurable links exist between these two distinct domains. Researchers compile finish times, track conditions, and payout structures from major circuits including those in the United States and Australia, then compare them against session-level variance metrics drawn from licensed blackjack platforms operating under state or provincial oversight.
Data Sources and Collection Methods
Regulated platforms in New Jersey and Pennsylvania supply anonymized blackjack outcome logs that researchers access through oversight portals maintained by the Pennsylvania Gaming Control Board, and similar datasets emerge from thoroughbred meets sanctioned by state racing commissions. Analysts aggregate these figures over multi-year periods to calculate standard deviation in blackjack returns and correlate them with variables such as average winning margins or favorite success rates in graded stakes races. One study released in July 2026 examined twelve months of overlapping data and reported correlation coefficients below 0.08 across most tested pairings, indicating minimal linear relationship between the two activity types.
Mathematical Properties of Blackjack Variance
Blackjack variance arises from fixed probabilities tied to deck composition, player decisions, and house rules that remain consistent within a regulated online session, whereas thoroughbred outcomes incorporate biological, environmental, and competitive factors that shift from race to race. Experts at academic institutions have modeled blackjack return distributions using binomial and normal approximations that produce stable variance estimates over large sample sizes, and those models show little sensitivity to external sporting results. Observers note that any apparent alignment between race-day volatility and blackjack swings tends to disappear once sample sizes exceed several thousand hands and races respectively.
Thoroughbred Performance Metrics
Thoroughbred datasets include speed figures, class levels, and post-position statistics that handicappers track across circuits such as Churchill Downs and Flemington, and these metrics undergo statistical scrutiny for patterns in upset frequency or margin distribution. When paired with blackjack logs from the same calendar windows, the resulting matrices reveal scattered weak associations that fail to reach statistical significance after correction for multiple comparisons. Data released in July 2026 from an industry consortium further confirmed that variance spikes in blackjack sessions aligned more closely with time-of-day and player volume than with contemporaneous race results.

Regulatory Oversight and Platform Standards
Platforms licensed by the New Jersey Division of Gaming Enforcement and the Victorian Commission for Gambling and Liquor Regulation maintain certified random number generators that enforce consistent variance parameters regardless of external events, and quarterly compliance reports document these controls in detail. Analysts cross-reference enforcement filings with public racing databases to test for hidden influences, yet repeated examinations have produced no evidence of synchronized movement between race payouts and table-game volatility. Regulatory filings from mid-2026 continue to emphasize that each product category operates under independent testing regimes that isolate performance variables.
Statistical Approaches Used in Recent Analyses
Researchers apply Pearson and Spearman correlation tests alongside regression models that control for seasonality and market liquidity, and results consistently place any detected relationship inside the noise range expected from unrelated stochastic processes. One peer-reviewed paper hosted by an Australian university repository examined 2.3 million blackjack hands against 14,000 thoroughbred starts and concluded that shared variance explained less than one percent of observed fluctuations. Those findings align with earlier work conducted in North American jurisdictions that reached similar null conclusions after adjusting for sample size and data granularity.
Implications for Data Analysts and Operators
Operators maintain separate risk models for racing products and table games because cross-domain correlations have not emerged at actionable levels, and compliance teams continue to monitor both verticals through distinct key performance indicators. Academic groups periodically revisit the question with expanded datasets, yet the pattern of negligible linkage persists across jurisdictions that include Ontario and several European licensing regimes. The July 2026 release added further confirmation that platform-level blackjack variance remains governed by internal parameters rather than external sporting calendars.
Conclusion
Available evidence from regulated markets shows that thoroughbred race results and blackjack variance operate as independent statistical domains, and ongoing analyses through 2026 have reinforced the absence of meaningful correlation. Analysts continue to examine new data streams as they become available, yet current figures indicate that any shared patterns fall within the range of random coincidence rather than systematic connection. Regulatory bodies and research teams maintain transparent reporting that supports continued separation of risk frameworks for each product type.