Comparative Analysis of Risk Assessment Models Utilized in Thoroughbred Handicapping and Blackjack Play
Erik Beck · Jul 22, 2026
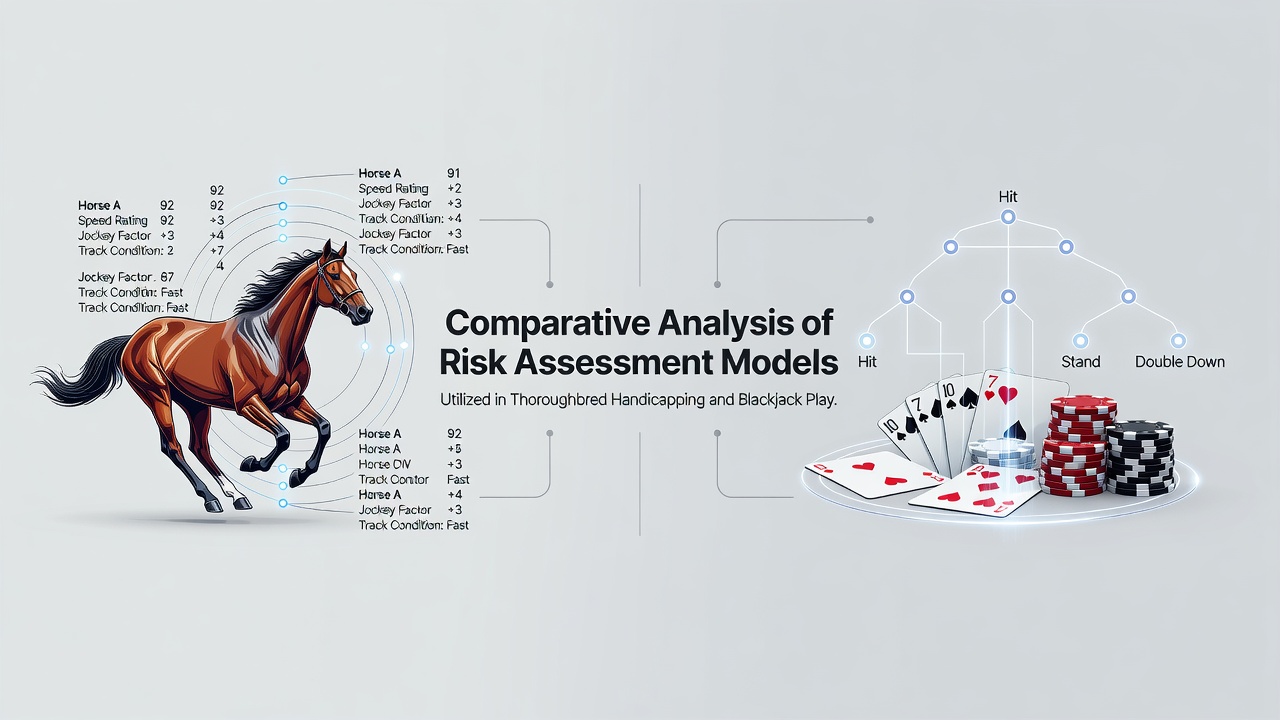
Comparative Analysis of Risk Assessment Models Utilized in Thoroughbred Handicapping and Blackjack Play
Thoroughbred handicapping and blackjack both rely on structured approaches to evaluate uncertainty, yet the underlying risk assessment models differ in data sources and application. Handicappers examine past performance records, pace figures, and track variables to project outcomes while blackjack players track card distributions and apply probability tables to minimize the house edge. These fields share a foundation in statistical evaluation but operate under distinct constraints that shape how models quantify potential losses and gains.Risk Frameworks in Thoroughbred Handicapping
Thoroughbred handicappers commonly employ multivariate regression models that integrate speed ratings, class levels, and workout data to generate probability estimates for each runner. Organizations such as the National Thoroughbred Racing Association publish standardized speed figure methodologies that allow consistent comparisons across races, and these models adjust for variables like surface condition and distance. Observers note that Bayesian updating techniques have gained traction in recent years because they permit incremental refinement of probabilities as new information emerges during the betting window.
Additional layers appear when analysts incorporate pace projection tools that forecast fractional times based on historical running styles. July 2026 data releases from several North American tracks highlighted how these pace models captured shifts in early speed more accurately than older linear approaches, particularly on synthetic surfaces. Risk assessment here centers on variance calculations that account for unpredictable factors such as post position and equipment changes, producing confidence intervals rather than single-point predictions.
Probability Structures in Blackjack
Blackjack risk models begin with combinatorial analysis of the finite deck, calculating exact probabilities for every possible hand outcome once the rules and number of decks are fixed. Basic strategy charts derived from these calculations reduce the house edge to under one percent in most casino settings, while card counting systems such as the Hi-Lo method track the ratio of high to low cards remaining. Variance models then estimate the standard deviation of returns over a given number of hands, guiding bet sizing decisions through formulas like the Kelly criterion.
Simulation software running millions of iterations supplements analytical methods by testing edge cases that combinatorial math alone cannot address quickly. Research institutions in Canada and Australia have published comparative studies showing how these Monte Carlo outputs align closely with theoretical expectations when deck penetration and player decisions remain constant. The models therefore emphasize expected value alongside ruin probability, allowing players to set session limits that reflect both short-term volatility and long-term edge.
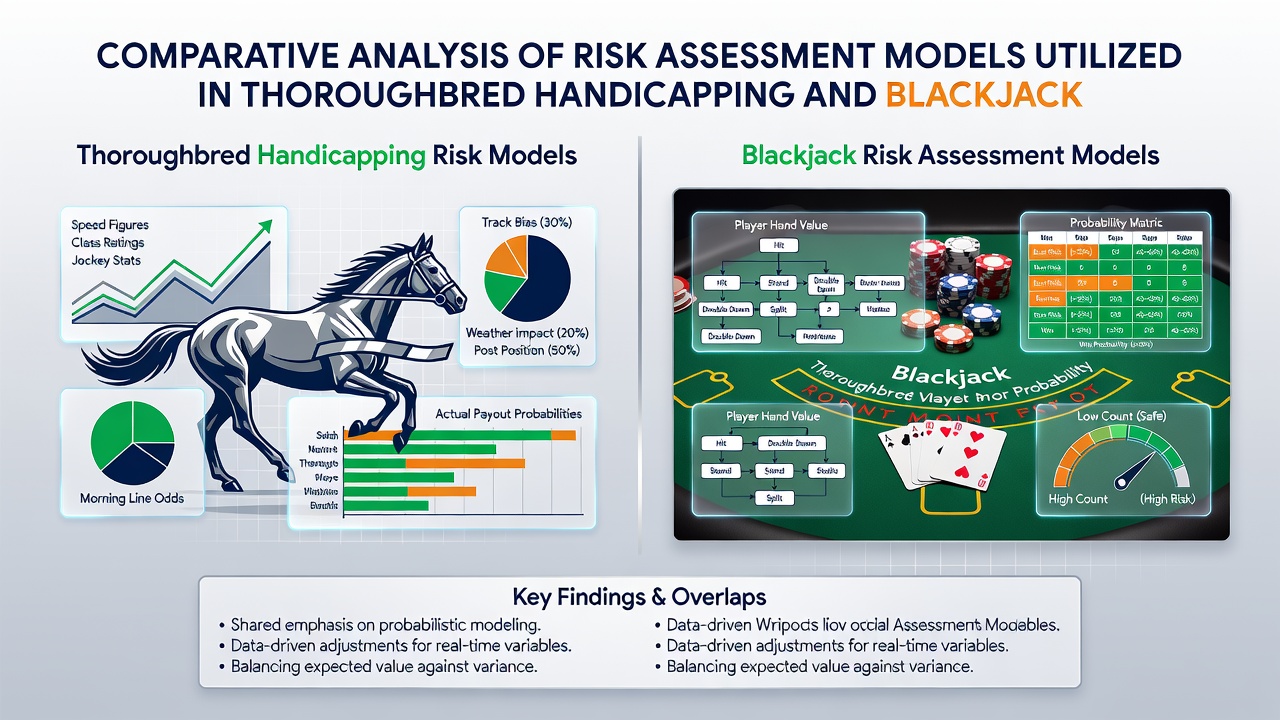
Key Points of Comparison
Both domains require ongoing calibration of models against fresh data, yet thoroughbred handicapping contends with higher numbers of external variables that resist precise quantification. Blackjack probabilities reset with each shuffle, creating a closed system where perfect information yields deterministic edges, whereas horse racing outcomes incorporate live factors such as jockey tactics and pace duels that emerge only after the gates open. Consequently, handicapping risk models incorporate wider error margins and rely more heavily on ensemble methods that average multiple indicators.
Capital allocation strategies reveal further distinctions. Blackjack practitioners often scale bets according to current edge estimates derived from running counts, producing dynamic risk exposure that fluctuates within a single shoe. Handicappers typically allocate across multiple races using fixed bankroll percentages informed by historical strike rates and average payouts, because individual race edges cannot be updated mid-event in the same way. Studies from European gaming research centers indicate that these allocation differences produce measurably distinct drawdown profiles over extended sequences.
Computational demands also diverge. Blackjack models can be executed with modest processing power once basic strategy tables exist, while thoroughbred applications increasingly draw on machine learning pipelines that process large datasets of past performances and biometric readings from horses. The trade-off appears in transparency: simpler blackjack formulas allow direct verification of edge calculations, whereas complex handicapping ensembles sometimes obscure the contribution of individual variables.
Conclusion
Comparative examination shows that risk assessment models in thoroughbred handicapping and blackjack share core statistical principles yet diverge in adaptability, variable control, and computational intensity. Thoroughbred approaches accommodate open-system uncertainty through layered indicators and ensemble averaging, while blackjack frameworks exploit closed-system certainty to refine exact probabilities and dynamic bet sizing. Data from regulatory bodies and academic sources continue to refine both sets of tools, supporting more precise evaluation of downside exposure across extended periods of play.